 A machine-learning model to improve mouse to human inference
What is FIT?
Cross-species differences form barriers to translational research that ultimately hinder the success of clinical trials. Yet systematic incorporation of the wealth of knowledge on species differences in the interpretation of animal model data is lacking. We have developed FIT (Found In Translation) a data-driven statistical methodology which leverages public domain gene expression data to predict from the results of a mouse experiment genes expected to be altered in the equivalent human phenotype.
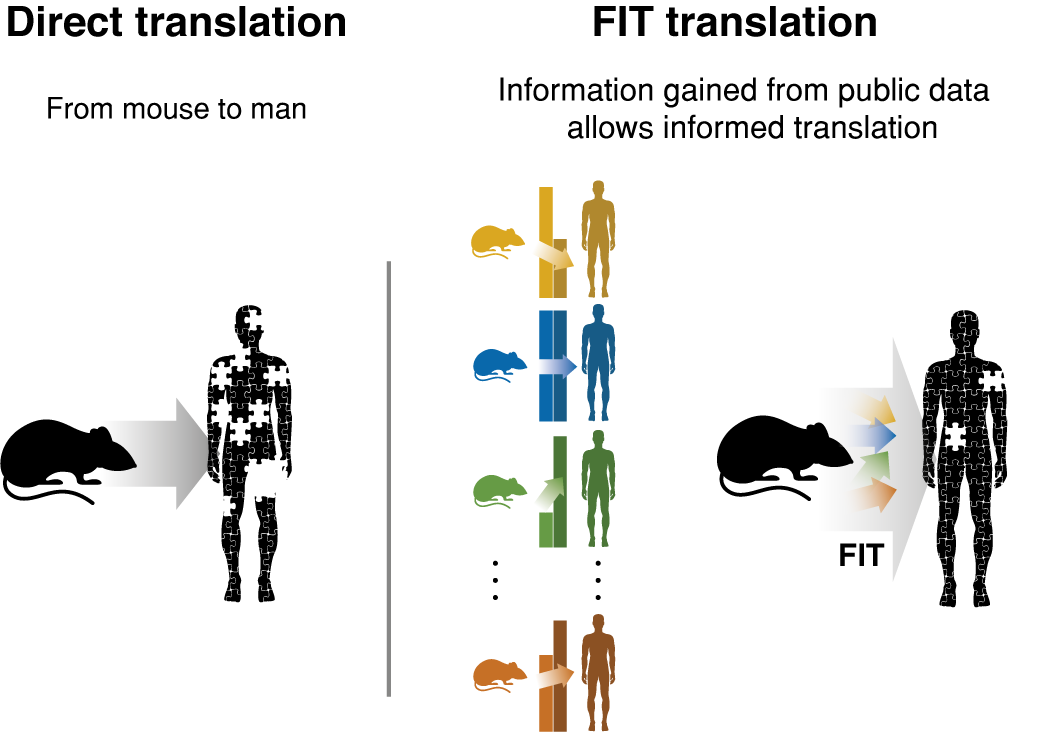
FIT is currently based on a reference dataset of 170 cross-species comparisons that spans 28 different diseases, all collected from the public domain (GEO). Given a new mouse gene expression dataset FIT computes the predicted human effect size values per gene based on the prior comparisons between the species. FIT produces a table that includes the predicted values as well as confidence intervals. The genes with the highest absolute values are the most probable to be differentially expresed in human. Genes with low confidence interval sizes have a higher chance of being related to the human disease.
FIT can be applied to any new mouse gene expression dataset, regardless of the technology it was measured in (RNA-seq/ Microarrays), the tissue type or the disease. The only requirement is for the dataset to includes at least 3 disease samples and at least 3 healthy control samples.
How does FIT work?
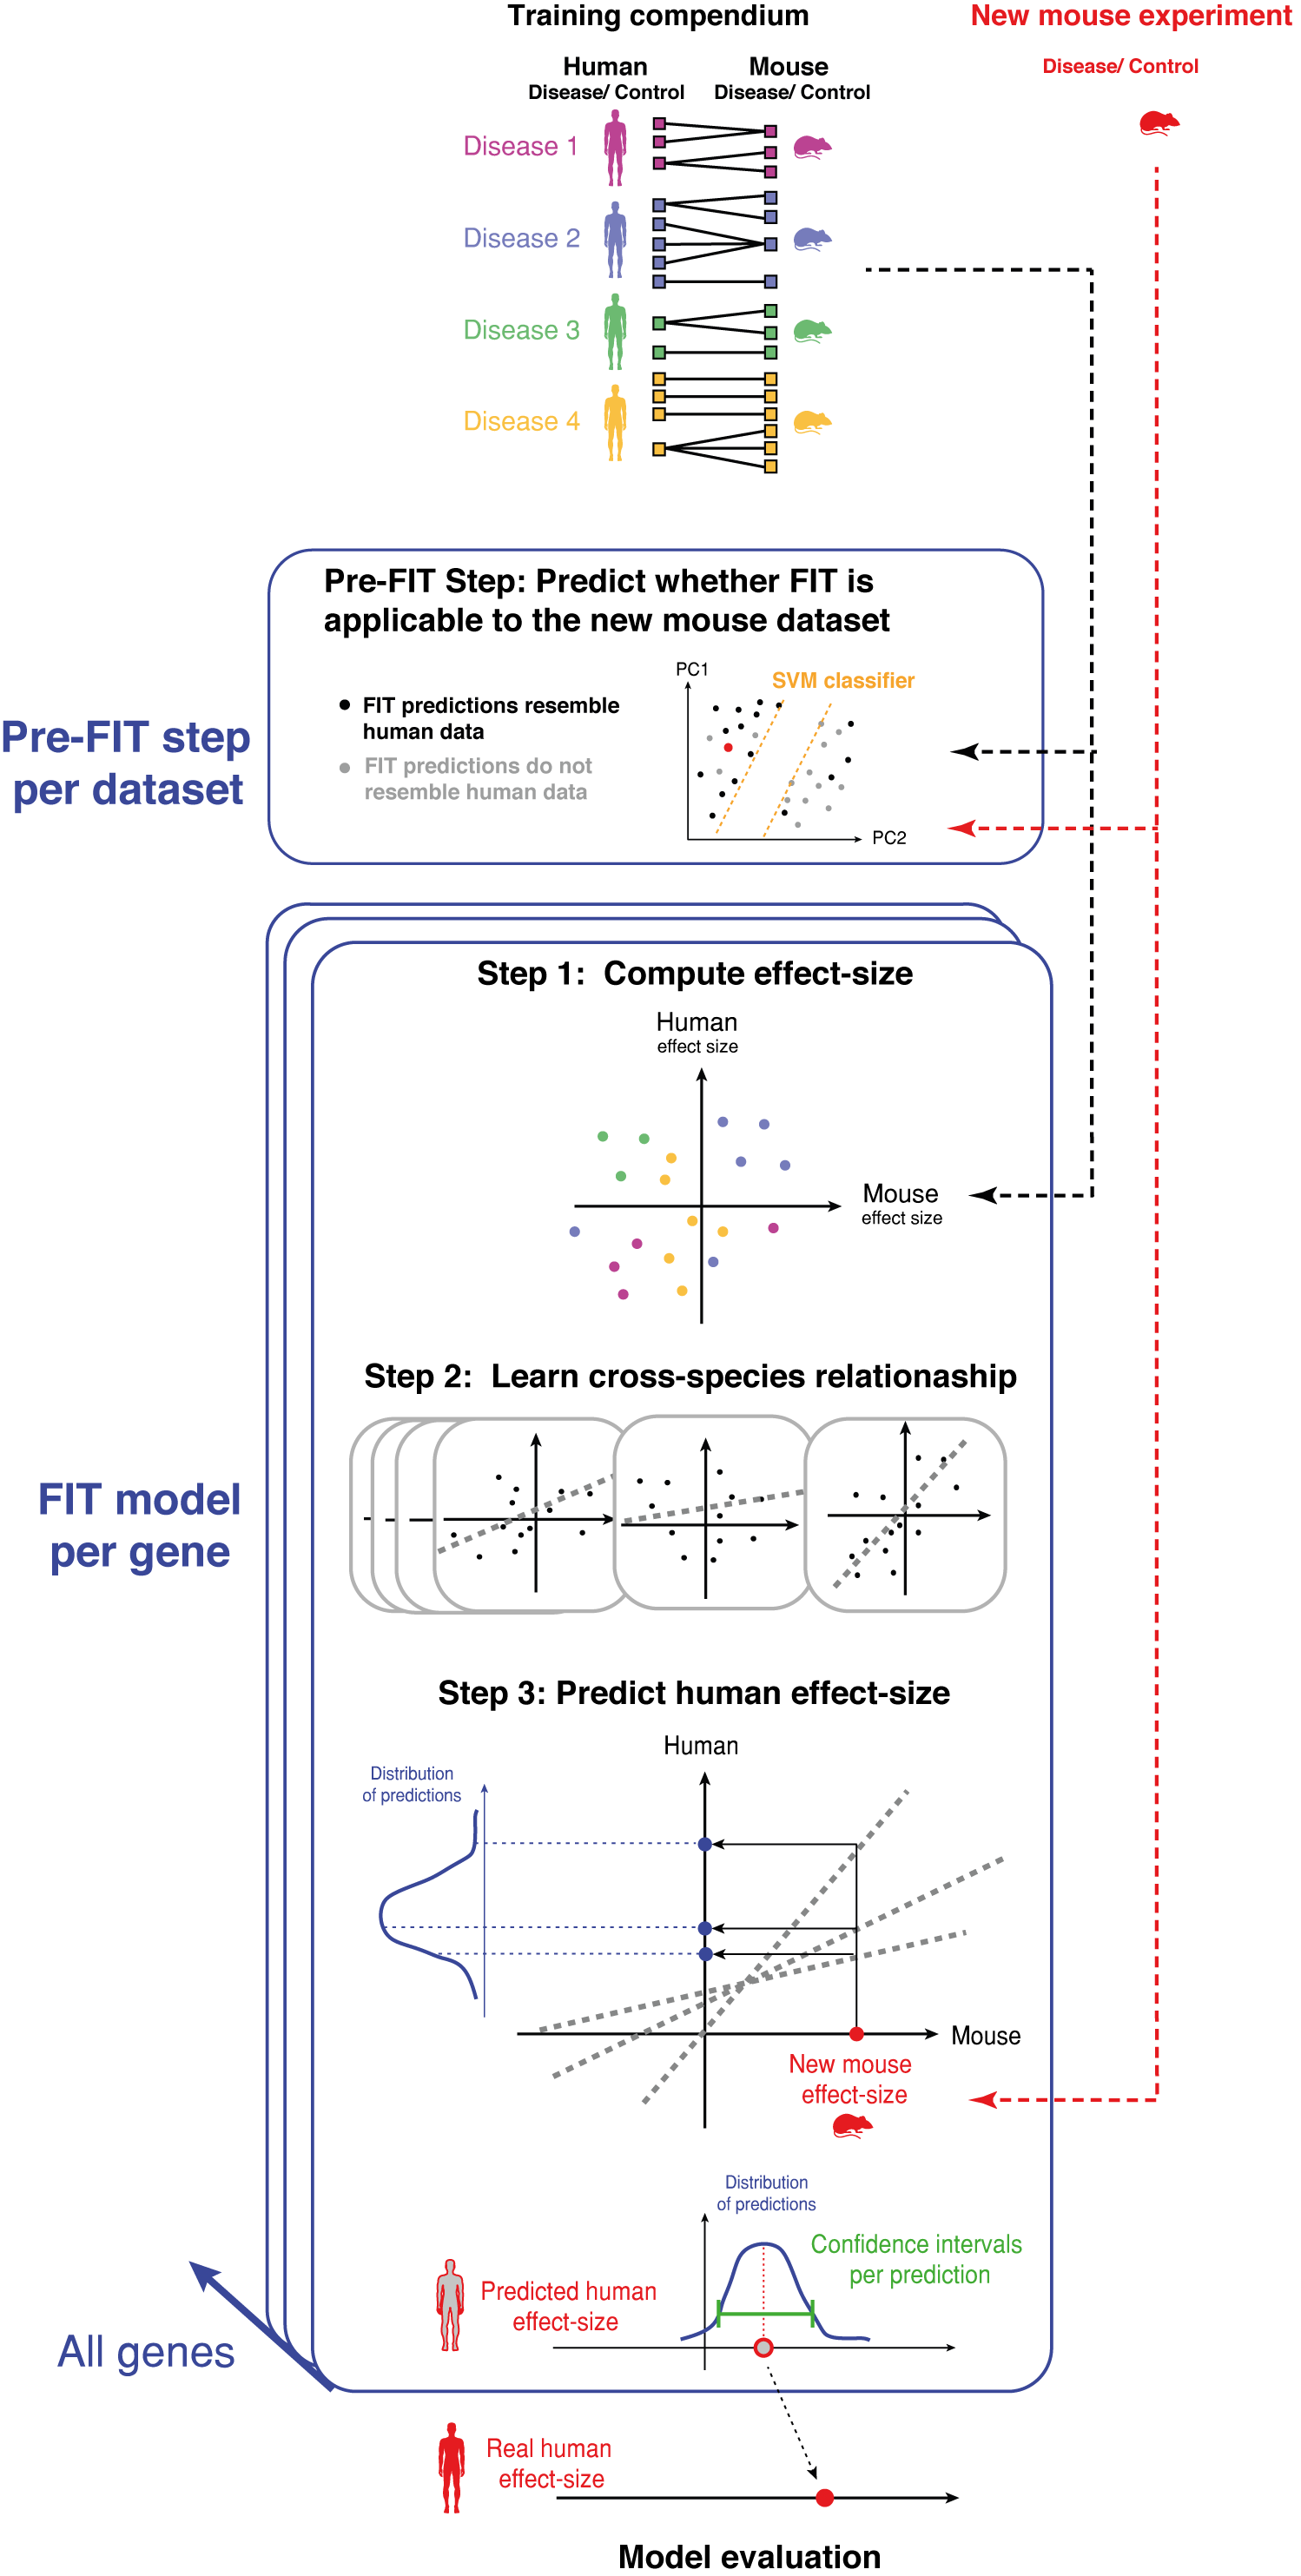
Due to the complexity of translating mouse to human biology FIT's performance in terms of predicting values that resemble human data, is variable across datasets. Therefore, in order to make FIT's usage accurate and applicable we have developed a highly accurate SVM classifier that predicts when FIT's performance is adequate, based on the similarity of the given mouse data to that of the training data. Running the SVM classifier is the pre-step to running FIT, it is done per dataset and determines whether it is beneficial running FIT on the given dataset. Given that the classifier suggests running FIT is beneficial, the input to FIT pipeline is a new mouse disease vs. control gene expression experiment, on which FIT will predict expected human values using the following three steps per gene in the input mouse experiment:
Step 1: For each mouse-human paired dataset in the compendium, FIT computes an effect-size between disease and control samples;
Step 2: FIT then learns the relation between the mouse and human disease effect-sizes using a set of regularized linear models obtained from repeated sampling;
Step 3: FIT estimates the human effect-size per gene as the mean of the regularized predictions. Confidence intervals are obtained from the sampling procedure. We then evaluate the model by comparing the predictions to human gene expression data from a parallel condition to that of the input mouse.
FIT pipeline overview
FIT is a statistical model that allows better inference on human biology from a mouse gene expression dataset. In order to use the tool you need to upload a gene-expression dataset in an excel worksheet (CSV format). The tool first checks that the file is in the correct format, pre-processes the data and then computes the predictions. The predictions are then presented on the site, as a table as well as a scatterplot presenting the reference data and predictions per gene. The results are available for download as an excel file for further analysis. The whole pipeline takes a few minutes to run.Mouse gene expression input file
The input file you should upload to the site is a CSV (comma separated values) file, which can be saved in Excel (File -> Save as -> CSV(Comma separated)).Microarray data specification:
The rows of the table represent genes and the columns are samples. The values are log-transformed expression
values. The first column should contain the gene names, as Entrez IDs. The first row should contain the sample names. The dataset should
contain at least 3 control samples and at least 3 disease samples. The sample names should include an annotation of which sample is control
and which is disease, in the following way: disease sample names should start with "d_" and control sample names should start with "c_".
If one of the following criteria regarding the file format is not met, an error message will be shown:
- Sample names start with either "c_" or "d_".
- There are at least 3 control and least 3 disease samples.
- The gene names are mouse Entrez IDs.
Example for the input file format is shown in Figure 1a on the right
RNAseq data specification:
The CSV file should contain 2 columns: the first is mosue Entrez gene IDs, and the second is effect size per gene.
The effect size can be acquired by using an RNAseq data analysis software, for exmaple Kallisto and Sleuth
(https://pachterlab.github.io/kallisto/, https://pachterlab.github.io/sleuth/).
Example for the input file format is shown in Figure 1b on the right
Analysis steps
Pre-FIT step: Is FIT applicable to your dataset: Use the "Is FIT applicable for you?" tab in order to run
the SVM classifier that predicts whether FIT is likely to prduce human-relevant result for your dataset. See more details on the classifier below.
Step 1: Upload the mouse experiment: To start a FIT analysis go the "Using FIT" tab in the site. In the
"Upload mouse data" section choose whether to upload your input data file (in a format as explained above)
or use sample data. Choose the technology in which the data was measured. Then, To load either dataset click on "Load data".
Step 2: Preprocess the data: Once the file upload is completed, you will be notified under the "Pipeline progress messages"
section that the file is in the correct format (or an error in case there is a problem with the file). Press the "Preprocess data" button.
Pre-processing begins with filtering the genes from the input table to those that have enough data from FIT's training data to allow predictions.
For microarrays the following values ar ecomputes: fold-change, Z-scores and Z-tests (also reffered to as effect-sizes).
Step 3: Run FIT analysis: Once the pre-processing is finished you will be notified in the "Pipeline progress messages" section how many
genes will have FIT predictions. Now click on "Run analysis" button to compute FIT predictions on your data. A progress bar will appear on
the bottom right corner.
Understanding the results
Once the predictions are computed (this should take up to a minute), the results will be presented as a table containing the following columns (Figure 3):
Human Entrez, Mouse Entrez, Human symbol, Mouse symbol - the mouse gene IDs and their human orthologs.
Original effect-size - the effect-size computed from the mouse gene expression dataset uploaded by the user.
FIT predicted value (percentile) - the percentile of the absolute value predicted by FIT. Genes with the highest absolute value are the ones
predicted by FIT to be human-relevant. Focusing on the percentiles, rather than the actual value, helps to interpret how important a specific gene is.
Up/Down - a plus or a minus sign, stating whether the FIT value was positive or negative. Note that the percentiles in the latter column are of absolute
values.
Confidence intervals (percentile) – along with the expression predictions, FIT produces confidence intervals per value. We show in our paper that
predictions with small confidence intervals have a higher chance of being correct (close to the human values). Here we supply the percentile of the
confidence interval size, to allow users to filter or sort the predictions based on their reliability.
Description - additional information about the gene.
In the example shown here we sorted the results by FIT percentiles. The first three genes have the highest predicted value, but their confidence
intervals are very big, meaning the prediction is less reliable. An interesting result would be the third gene in the results, Actc1, which shows both a
high prediction percentile and a low confidence interval percentile.
Additional features
Sorting - The results table can be sorted by any column, using the small arrows near each column name. To get the genes that are considered most
relevant by FIT, the table should be sorted by "FIT predicted value - percentile".
Visualization of the reference data of each gene - When clicking on a specific gene in the results table the reference data of that gene appears as
a scatter plot (human effect size vs. mouse effect size, Figure 4)). In addition, the scatter plot shows the slopes computed by the model in 100 bootstrapping
steps (light grey lines). The slopes help identify what the correlation between the species is compared to a slope=1, which is also illustrated in the plot (dotted black line).
Downloading results - The user can download the results by clicking the "Download Predictions" available on the left panel. The downloaded table
include additional columns not shown on the site (for simplicity):
- Original fold-change - the fold-change of each gene as computed from the uploaded mouse dataset. This value was used to compute the effect-size per
gene which was given as input to FIT.
- FIT predicted value - the raw value, rather than the percentile that is shown in the site.
- Confidence interval low/ high/ size - the low and high values of the 95% confidence interval, and the total size of the confidence interval.
Download training data
The training data is downloaded as a tab-delimited file. Since it is very big (1.7 million rows)
it is best to open it with Notepad++ or directly load it into a script.
Download
An SVM classifier that predicts FIT's perfromance
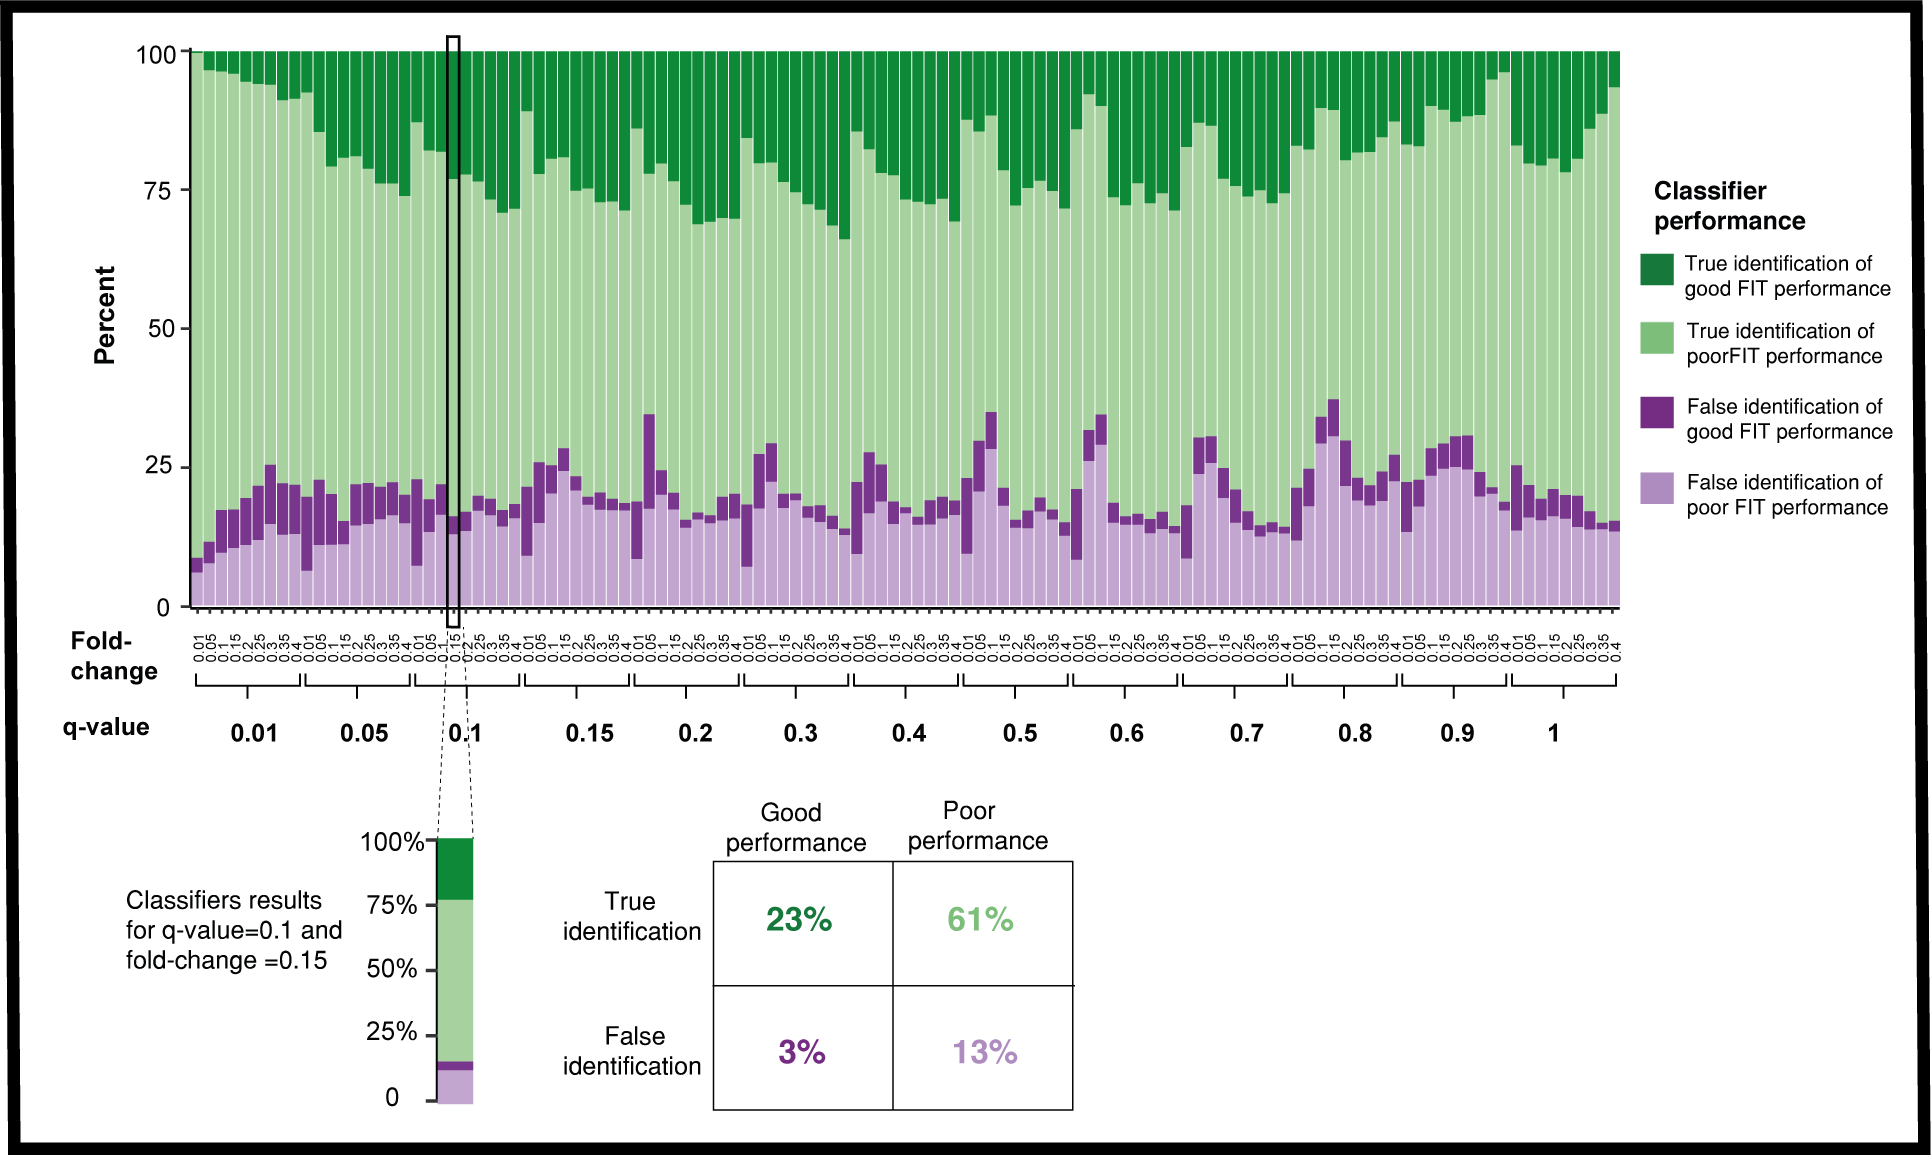
To enable robust use of the FIT methodology for inference on a new mouse dataset, we built a classifier aimed at predicting when FIT will
improve similarity to human data based on the mouse gene expression. Specifically, we performed PCA on the mouse gene expression data and
observed a notable separation of good versus poor FIT performance in the PC space, which could be seen even in the first principle component,
suggesting that similarity of expression of the new mouse results to the mouse data in the training compendium may be predictive of FIT performance.
To test this, we trained an SVM classifier on the first 50 principle components of the mouse expression data, capturing more than 80% of the
variation. Using a leave-one-disease-out methodology, across all fold-change and q-value thresholds, the classifier correctly predicted in an
average of 80% of the tested cases whether FIT will provide benefit (i.e. an increase of TP rate compared to conventional analysis of the mouse data,
see Figure 5).
You can run the classifier and test whether FIT is likely to improve your data in the tab "Is FIT applicable for you?".
Example for the input file format is shown in Figure 1b on the right
Analysis steps
Pre-FIT step: Is FIT applicable to your dataset: Use the "Is FIT applicable for you?" tab in order to run the SVM classifier that predicts whether FIT is likely to prduce human-relevant result for your dataset. See more details on the classifier below. Step 1: Upload the mouse experiment: To start a FIT analysis go the "Using FIT" tab in the site. In the "Upload mouse data" section choose whether to upload your input data file (in a format as explained above) or use sample data. Choose the technology in which the data was measured. Then, To load either dataset click on "Load data".Step 2: Preprocess the data: Once the file upload is completed, you will be notified under the "Pipeline progress messages" section that the file is in the correct format (or an error in case there is a problem with the file). Press the "Preprocess data" button. Pre-processing begins with filtering the genes from the input table to those that have enough data from FIT's training data to allow predictions. For microarrays the following values ar ecomputes: fold-change, Z-scores and Z-tests (also reffered to as effect-sizes).
Step 3: Run FIT analysis: Once the pre-processing is finished you will be notified in the "Pipeline progress messages" section how many genes will have FIT predictions. Now click on "Run analysis" button to compute FIT predictions on your data. A progress bar will appear on the bottom right corner.
Understanding the results
Once the predictions are computed (this should take up to a minute), the results will be presented as a table containing the following columns (Figure 3):Human Entrez, Mouse Entrez, Human symbol, Mouse symbol - the mouse gene IDs and their human orthologs.
Original effect-size - the effect-size computed from the mouse gene expression dataset uploaded by the user.
FIT predicted value (percentile) - the percentile of the absolute value predicted by FIT. Genes with the highest absolute value are the ones predicted by FIT to be human-relevant. Focusing on the percentiles, rather than the actual value, helps to interpret how important a specific gene is.
Up/Down - a plus or a minus sign, stating whether the FIT value was positive or negative. Note that the percentiles in the latter column are of absolute values.
Confidence intervals (percentile) – along with the expression predictions, FIT produces confidence intervals per value. We show in our paper that predictions with small confidence intervals have a higher chance of being correct (close to the human values). Here we supply the percentile of the confidence interval size, to allow users to filter or sort the predictions based on their reliability.
Description - additional information about the gene.
In the example shown here we sorted the results by FIT percentiles. The first three genes have the highest predicted value, but their confidence intervals are very big, meaning the prediction is less reliable. An interesting result would be the third gene in the results, Actc1, which shows both a high prediction percentile and a low confidence interval percentile.
Additional features
Sorting - The results table can be sorted by any column, using the small arrows near each column name. To get the genes that are considered most relevant by FIT, the table should be sorted by "FIT predicted value - percentile".
Visualization of the reference data of each gene - When clicking on a specific gene in the results table the reference data of that gene appears as a scatter plot (human effect size vs. mouse effect size, Figure 4)). In addition, the scatter plot shows the slopes computed by the model in 100 bootstrapping steps (light grey lines). The slopes help identify what the correlation between the species is compared to a slope=1, which is also illustrated in the plot (dotted black line).
Downloading results - The user can download the results by clicking the "Download Predictions" available on the left panel. The downloaded table include additional columns not shown on the site (for simplicity):
- Original fold-change - the fold-change of each gene as computed from the uploaded mouse dataset. This value was used to compute the effect-size per gene which was given as input to FIT.
- FIT predicted value - the raw value, rather than the percentile that is shown in the site.
- Confidence interval low/ high/ size - the low and high values of the 95% confidence interval, and the total size of the confidence interval.
Download training data
The training data is downloaded as a tab-delimited file. Since it is very big (1.7 million rows) it is best to open it with Notepad++ or directly load it into a script.Download
An SVM classifier that predicts FIT's perfromance
To enable robust use of the FIT methodology for inference on a new mouse dataset, we built a classifier aimed at predicting when FIT will improve similarity to human data based on the mouse gene expression. Specifically, we performed PCA on the mouse gene expression data and observed a notable separation of good versus poor FIT performance in the PC space, which could be seen even in the first principle component, suggesting that similarity of expression of the new mouse results to the mouse data in the training compendium may be predictive of FIT performance. To test this, we trained an SVM classifier on the first 50 principle components of the mouse expression data, capturing more than 80% of the variation. Using a leave-one-disease-out methodology, across all fold-change and q-value thresholds, the classifier correctly predicted in an average of 80% of the tested cases whether FIT will provide benefit (i.e. an increase of TP rate compared to conventional analysis of the mouse data, see Figure 5).
You can run the classifier and test whether FIT is likely to improve your data in the tab "Is FIT applicable for you?".
Figure 1a: Example of microarray input file
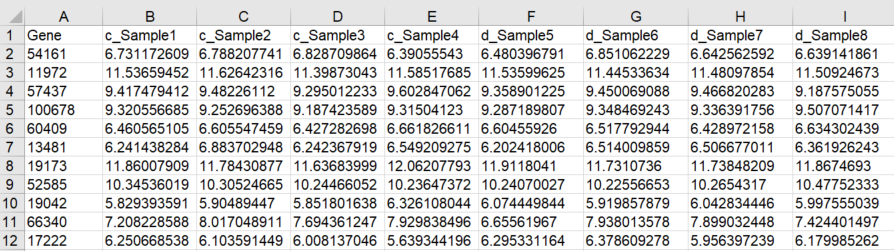
Figure 1b: Example of RNAseq input file
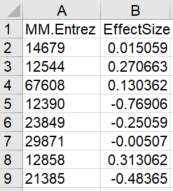
Figure 2: Running FIT
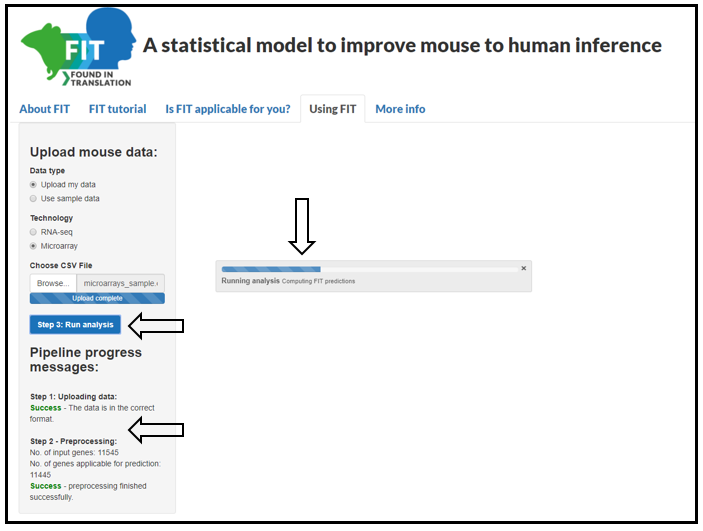
Figure 3: Results
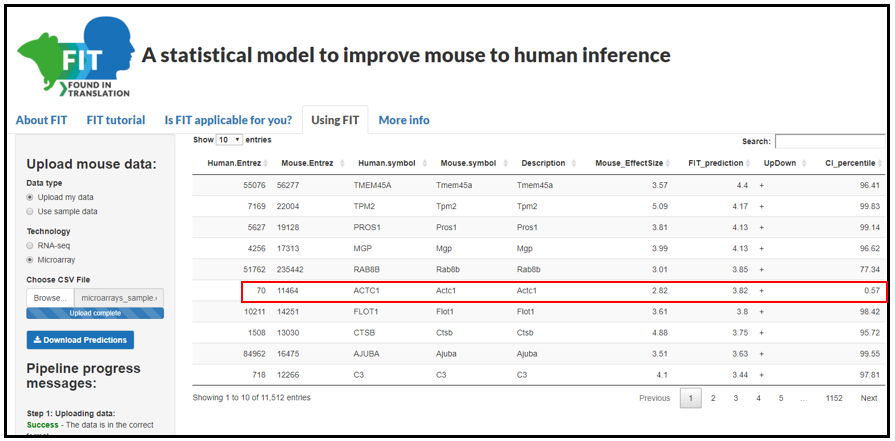
Figure 4: Reference data and slope prediction per gene
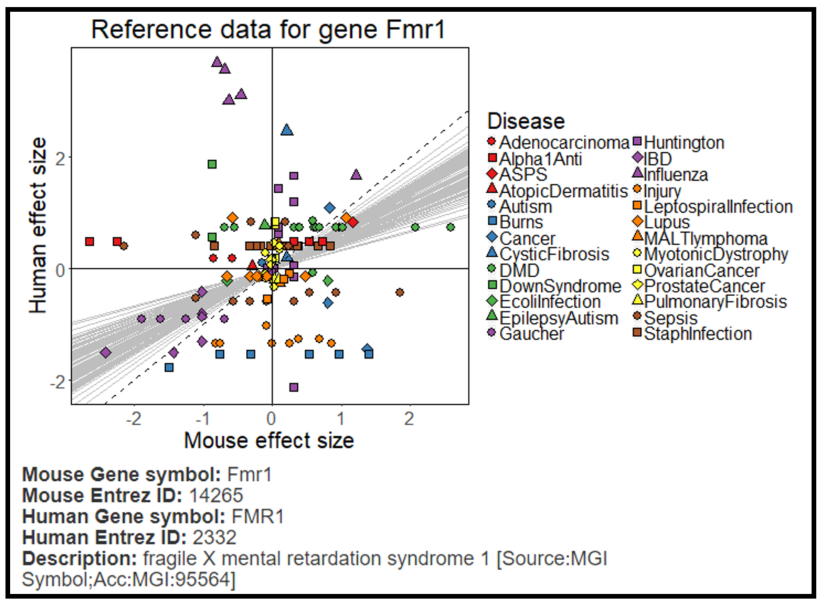
Figure 5: The performance of the SVM classifier in predicting FIT's ability to improve the mouse results
Test whether your data is applicable for translation improvement:
Upload data:
Choose thresholds:
Classifier results:
FIT package version used: 1.2
Site version: 1.0
FIT was developed in Prof. Shai Shen-Orr's lab at the Technion, Israel Institute of Technology.
Lab site: http://shenorrlab.technion.ac.il/.
Contact:
Prof. Shai Shen-Orr: shenorr@technion.ac.il
Rachelly Normand: rachelly@campus.technion.ac.il
Cite: The manuscript will be published in Nature Methods on December 2018.